the venn diagram represents the results of a survey that asked participants whether they would want a dog or…
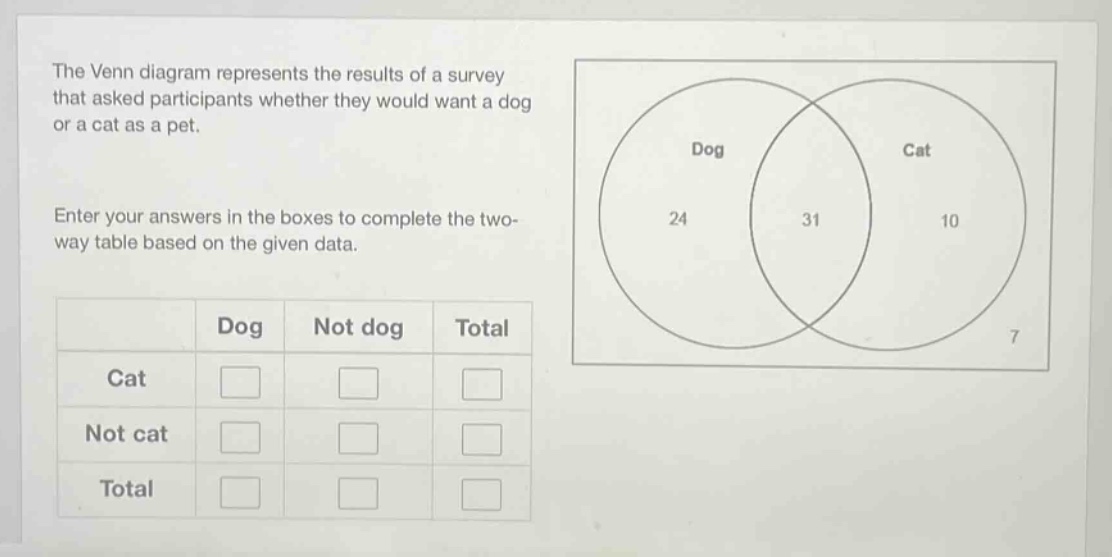
the venn diagram represents the results of a survey that asked participants whether they would want a dog or a cat as a pet. enter your answers in the boxes to complete the two - way table based on the given data.\n| | dog | not dog | total |\n|--|--|--|--|\n| cat | | | |\n| not cat | | | |\n| total | | | |
Answer
Explanation:
Step1: Determine number of cat - dog intersection
The number of people who want both a cat and a dog is the intersection of the two circles in the Venn - diagram, which is 31.
Step2: Determine number of cat - not dog
The number of people who want a cat but not a dog is 10.
Step3: Determine total number of cat
The total number of people who want a cat is $31 + 10=41$.
Step4: Determine number of not cat - dog
The number of people who want a dog but not a cat is 24.
Step5: Determine number of not cat - not dog
The number of people who want neither a cat nor a dog is 7.
Step6: Determine total number of not cat
The total number of people who don't want a cat is $24 + 7=31$.
Step7: Determine total number of dog
The total number of people who want a dog is $24+31 = 55$.
Step8: Determine total number of not dog
The total number of people who don't want a dog is $10 + 7=17$.
Step9: Determine total number of participants
The total number of participants is $24+31+10 + 7=72$.
Answer:
| Dog | Not dog | Total | |
|---|---|---|---|
| Cat | 31 | 10 | 41 |
| Not cat | 24 | 7 | 31 |
| Total | 55 | 17 | 72 |