the venn diagram shows the number of customers who have purchased different types of pets from a pet store…
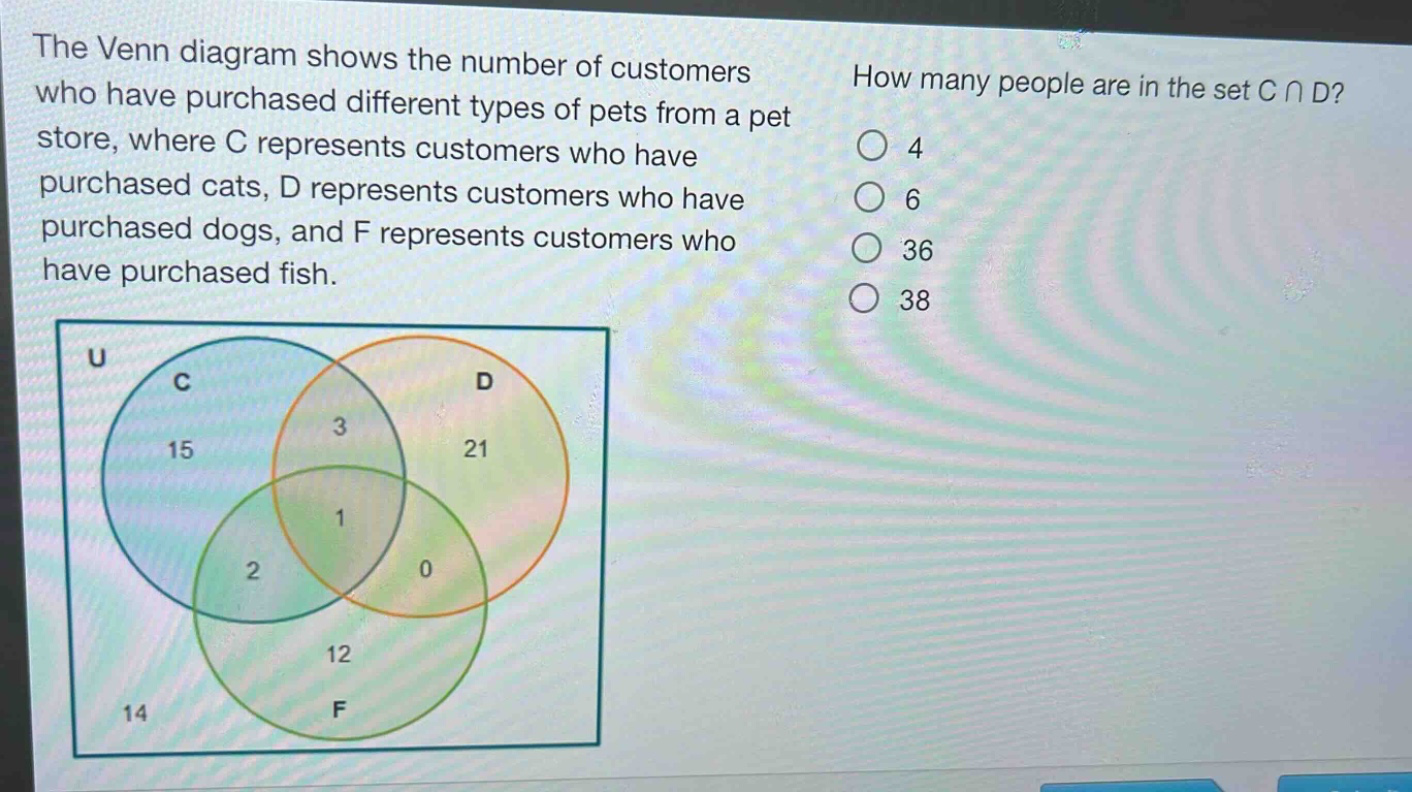
the venn diagram shows the number of customers who have purchased different types of pets from a pet store, where c represents customers who have purchased cats, d represents customers who have purchased dogs, and f represents customers who have purchased fish. how many people are in the set ( ccap d )? 4 6 36 38
Answer
Explanation:
Step 1: Identify the intersection of sets C and D in the Venn diagram
The intersection ( C \cap D ) includes all regions where circles C and D overlap, regardless of overlap with F.
Step 2: Sum the values in the overlapping regions
The overlapping regions between C and D are the area with value 3 (only C and D) and 1 (C, D, and F). Adding these gives ( 3 + 1 = 4 ).
Answer:
A. 4