veronique has a spinner with three sections of equal size, red (r), green (g), and blue (b). the spinner is…
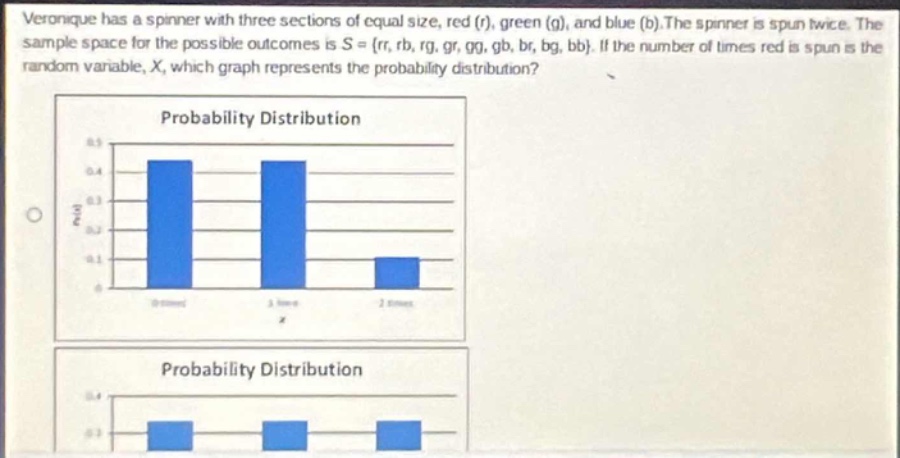
veronique has a spinner with three sections of equal size, red (r), green (g), and blue (b). the spinner is spun twice. the sample space for the possible outcomes is s = {rr, rb, rg, gr, gg, gb, br, bg, bb}. if the number of times red is spun is the random variable, x, which graph represents the probability distribution? probability distribution probability distribution
Answer
Explanation:
Step1: Calculate total number of outcomes
The sample - space $S={rr, rb, rg, gr, gg, gb, br, bg, bb}$, so $n(S) = 9$.
Step2: Calculate $P(X = 0)$
The outcomes where red is spun 0 times are ${gg, gb, bg, bb}$, so $n(X = 0)=4$. Then $P(X = 0)=\frac{4}{9}\approx0.44$.
Step3: Calculate $P(X = 1)$
The outcomes where red is spun 1 time are ${rb, rg, gr, br}$, so $n(X = 1)=4$. Then $P(X = 1)=\frac{4}{9}\approx0.44$.
Step4: Calculate $P(X = 2)$
The outcome where red is spun 2 times is ${rr}$, so $n(X = 2)=1$. Then $P(X = 2)=\frac{1}{9}\approx0.11$.
The probability distribution has $P(X = 0)\approx0.44$, $P(X = 1)\approx0.44$ and $P(X = 2)\approx0.11$. The first graph (where the bar for $X = 0$ and $X = 1$ is around 0.4 - 0.5 and the bar for $X = 2$ is around 0.1) represents the correct probability distribution.
Answer:
The first graph.