a veterinarian creates a box plot of the weights of the cats she treated last week at her animal hospital…
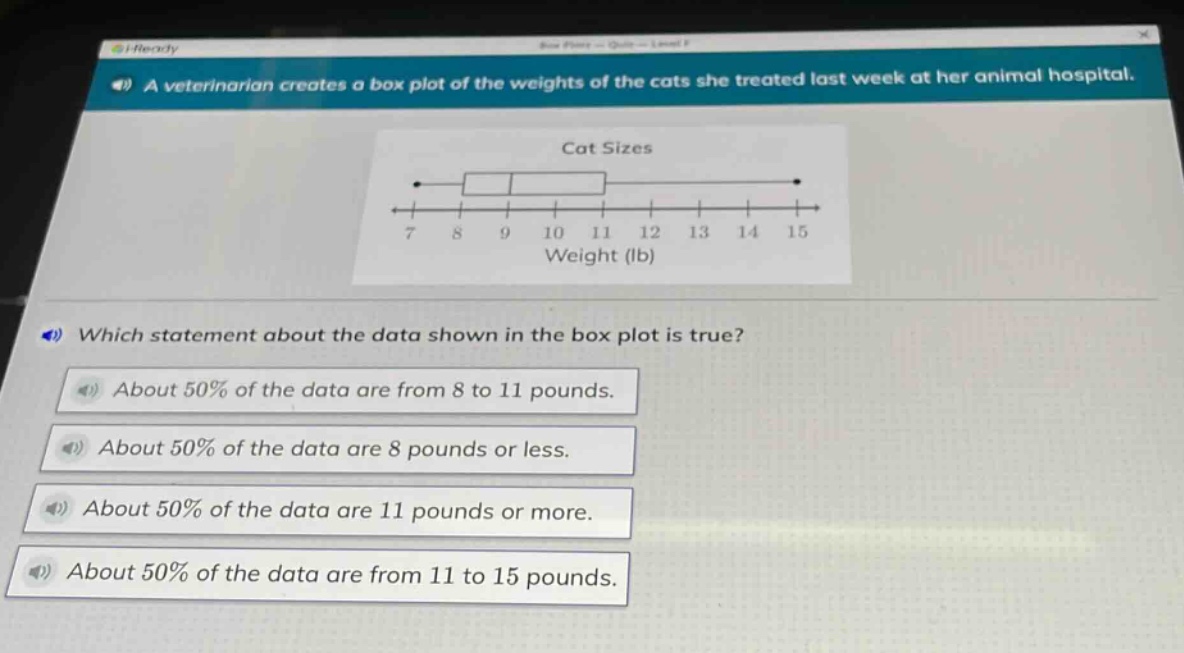
a veterinarian creates a box plot of the weights of the cats she treated last week at her animal hospital. which statement about the data shown in the box plot is true? about 50% of the data are from 8 to 11 pounds. about 50% of the data are 8 pounds or less. about 50% of the data are 11 pounds or more. about 50% of the data are from 11 to 15 pounds.
Answer
Explanation:
Step1: Recall box - plot properties
In a box - plot, the box represents the inter - quartile range (IQR). The lower quartile ($Q_1$) is the left - hand side of the box and the upper quartile ($Q_2$) is the right - hand side of the box. The IQR contains about 50% of the data.
Step2: Identify quartiles from the box - plot
From the given box - plot, the left - hand side of the box is at 8 pounds (lower quartile $Q_1$) and the right - hand side of the box is at 11 pounds (upper quartile $Q_2$). So, about 50% of the data are from 8 to 11 pounds.
Answer:
About 50% of the data are from 8 to 11 pounds.