a veterinarian creates a box - plot of the weights of the cats she treated last week at her animal hospital…
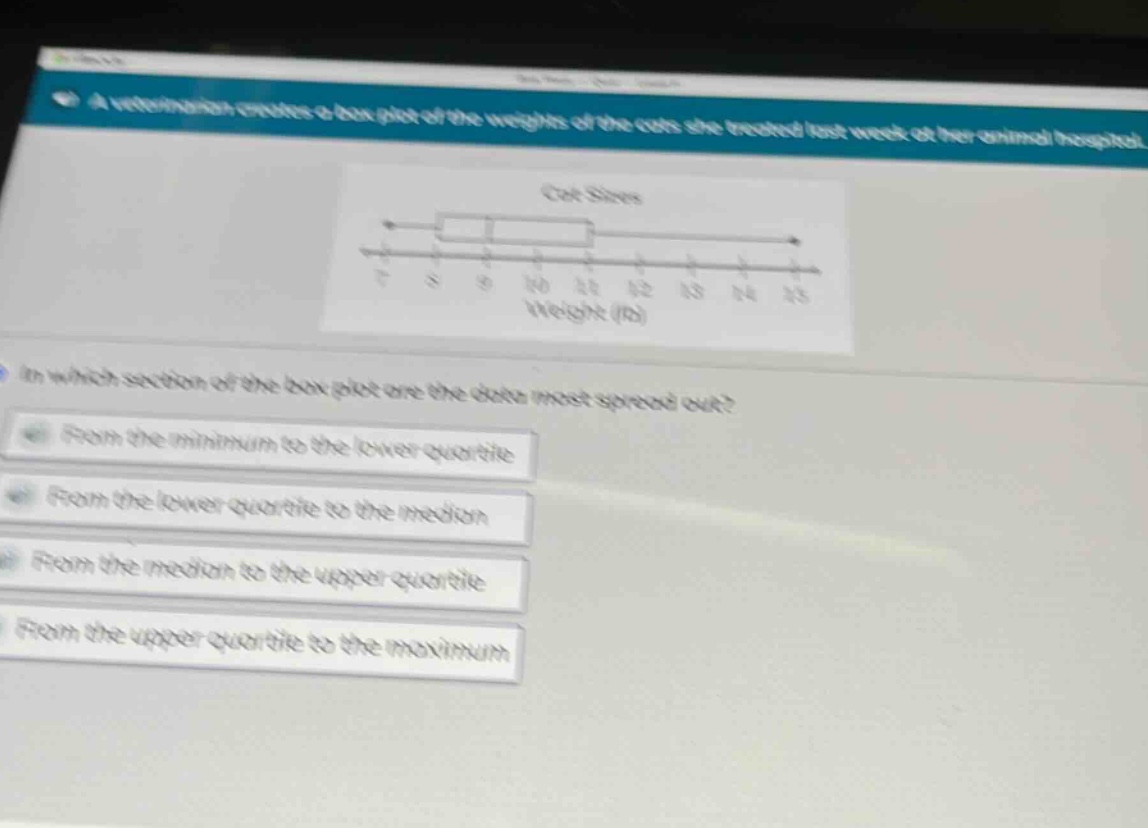
a veterinarian creates a box - plot of the weights of the cats she treated last week at her animal hospital. in which section of the box - plot are the data most spread out? from the minimum to the lower quartile from the lower quartile to the median from the median to the upper quartile from the upper quartile to the maximum
Answer
Explanation:
Step1: Analyze box - plot sections
In a box - plot, the spread is determined by the length of the section.
Step2: Measure lengths
Measure the lengths of each section: minimum - lower quartile, lower quartile - median, median - upper quartile, upper quartile - maximum.
Step3: Compare lengths
By visual inspection or measurement, we can see that the section from the upper quartile to the maximum has the longest length.
Answer:
From the upper quartile to the maximum