vivian surveyed bicyclists in her community to see the average number of miles they biked per day. her…
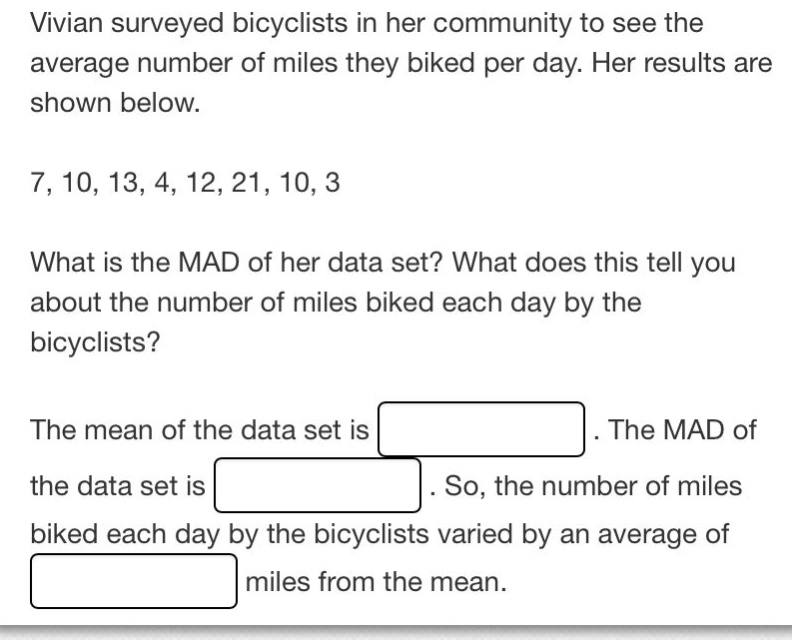
vivian surveyed bicyclists in her community to see the average number of miles they biked per day. her results are shown below. 7, 10, 13, 4, 12, 21, 10, 3 what is the mad of her data set? what does this tell you about the number of miles biked each day by the bicyclists? the mean of the data set is. the mad of the data set is. so, the number of miles biked each day by the bicyclists varied by an average of miles from the mean.
Answer
Explanation:
Step1: Calculate the mean
The data set is (7, 10, 13, 4, 12, 21, 10, 3). The sum of the data is (7 + 10+13 + 4+12+21+10+3=80). There are (n = 8) data - points. The mean (\bar{x}=\frac{80}{8}=10).
Step2: Calculate the absolute - deviations
The absolute deviations from the mean for each data - point are: (\vert7 - 10\vert=3), (\vert10 - 10\vert = 0), (\vert13 - 10\vert=3), (\vert4 - 10\vert = 6), (\vert12 - 10\vert=2), (\vert21 - 10\vert = 11), (\vert10 - 10\vert=0), (\vert3 - 10\vert = 7).
Step3: Calculate the MAD
The sum of the absolute deviations is (3+0 + 3+6+2+11+0+7 = 32). The MAD (Mean Absolute Deviation) is (\frac{32}{8}=4).
Answer:
The mean of the data set is (10). The MAD of the data set is (4). So, the number of miles biked each day by the bicyclists varied by an average of (4) miles from the mean.