on weekends, mr. rubio sells paletas, or mexican popsicles, from a cart. the number of customers he has…
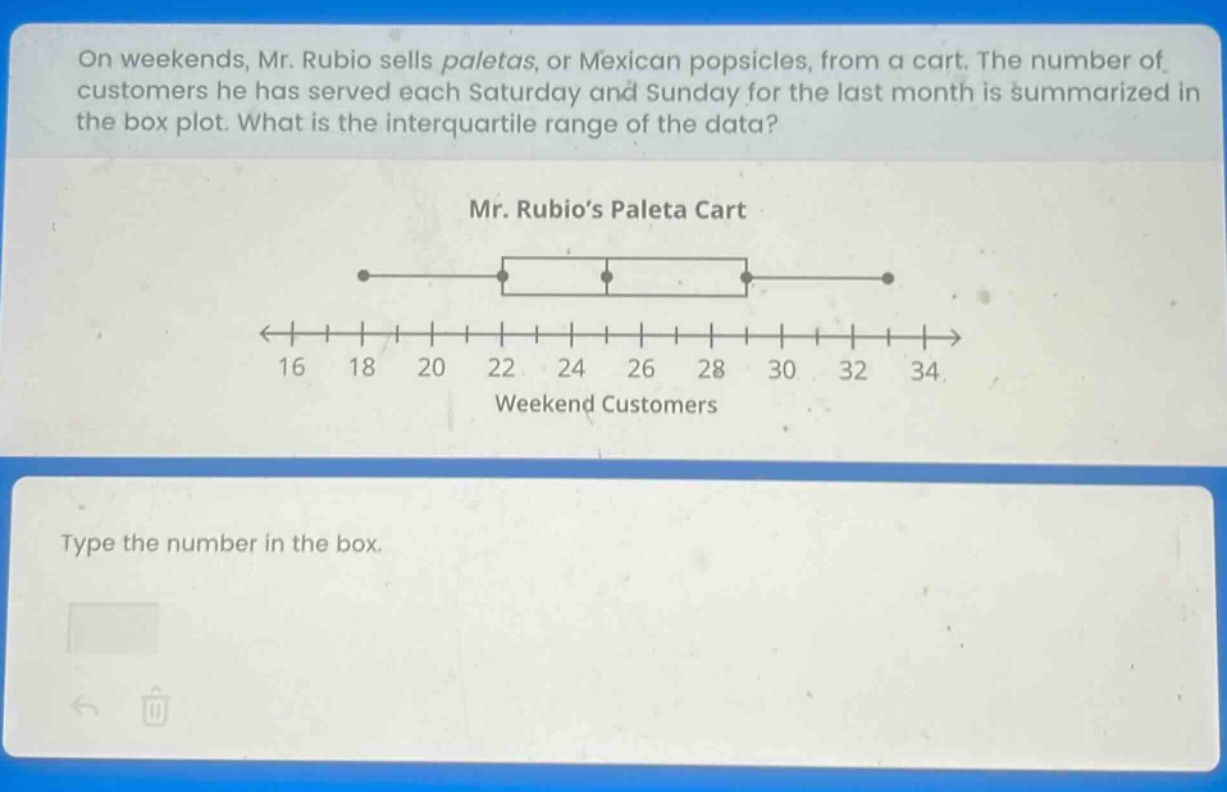
on weekends, mr. rubio sells paletas, or mexican popsicles, from a cart. the number of customers he has served each saturday and sunday for the last month is summarized in the box plot. what is the interquartile range of the data? mr. rubio’s paleta cart 16 18 20 22 24 26 28 30 32 34 weekend customers type the number in the box.
Answer
Answer:
8
Explanation:
Step1: Identify Q1 and Q3
In a box - plot, the left - hand side of the box is Q1 and the right - hand side is Q3. Here, Q1 = 22 and Q3 = 30.
Step2: Calculate interquartile range
The interquartile range (IQR) is given by IQR=Q3 - Q1. So, IQR = 30 - 22=8.