the weights (to the nearest five pounds) of 32 randomly selected male college students are organized in the…
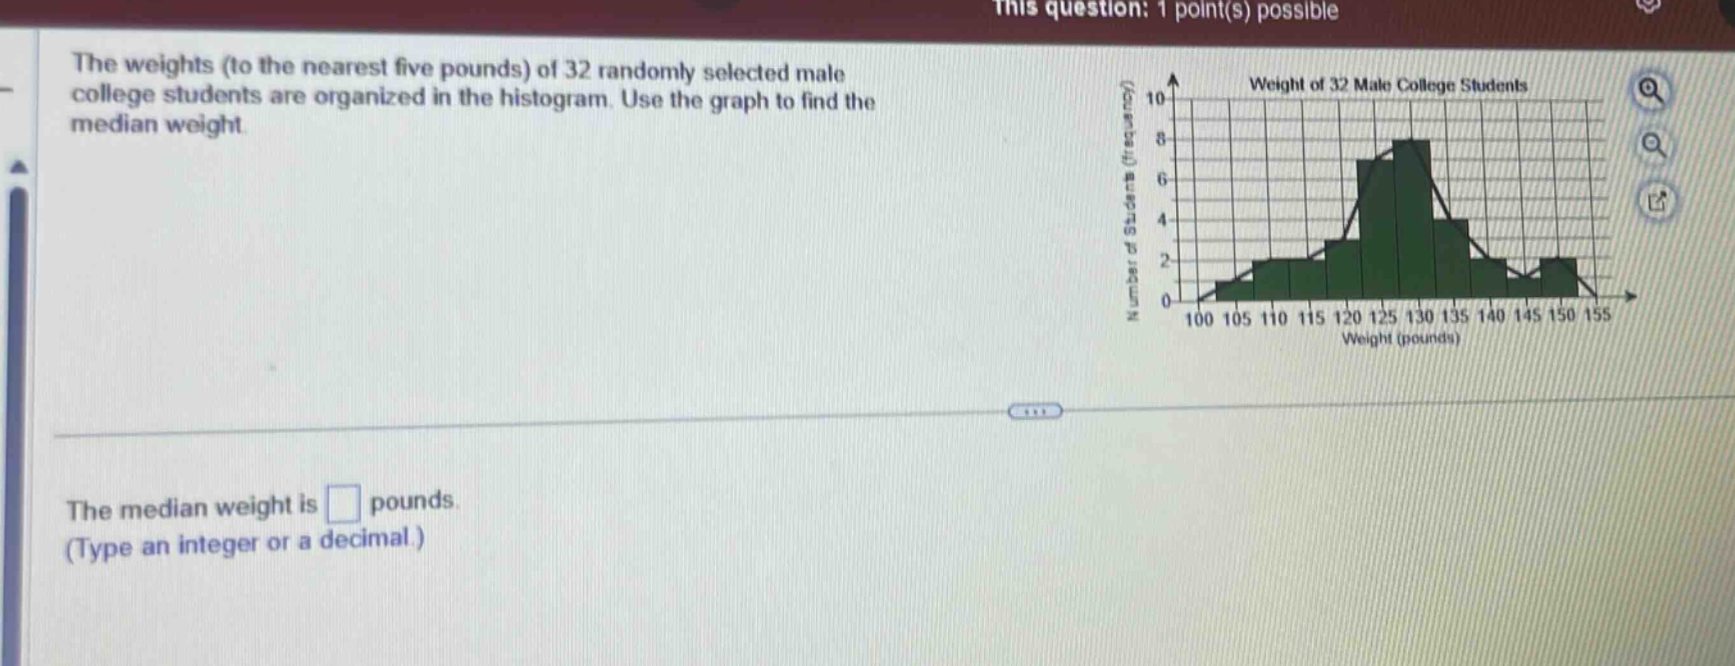
the weights (to the nearest five pounds) of 32 randomly selected male college students are organized in the histogram. use the graph to find the median weight. the median weight is pounds. (type an integer or a decimal.)
Answer
Explanation:
Step1: Determine position of median
For $n = 32$ (even - numbered data set), the median is the average of the $\frac{n}{2}$th and $(\frac{n}{2}+ 1)$th ordered data - values. $\frac{n}{2}=\frac{32}{2}=16$ and $\frac{n}{2}+1 = 17$. So, we need to find the 16th and 17th ordered data - values.
Step2: Cumulative frequency calculation
Starting from the left - hand side of the histogram:
- For the weight interval 100 - 105, frequency $f_1=1$. Cumulative frequency $CF_1 = 1$.
- For 105 - 110, $f_2 = 2$, $CF_2=1 + 2=3$.
- For 110 - 115, $f_3 = 3$, $CF_3=3 + 3=6$.
- For 115 - 120, $f_4 = 4$, $CF_4=6 + 4 = 10$.
- For 120 - 125, $f_5 = 7$, $CF_5=10 + 7=17$. The 16th and 17th values fall within the 120 - 125 interval.
Step3: Assume uniform distribution within the interval
We assume that the data is uniformly distributed within the 120 - 125 interval. The lower limit of the interval $L = 120$, the frequency of the interval $f = 7$, the cumulative frequency of the previous interval $CF = 10$, and the class width $w=5$. The formula for the median of grouped data is $M = L+\frac{\frac{n}{2}-CF}{f}\times w$. Substituting the values: $\frac{n}{2}=16$, $CF = 10$, $f = 7$, $L = 120$, $w = 5$. $M=120+\frac{16 - 10}{7}\times5=120+\frac{30}{7}\approx120 + 4.29=124.29$. But since the weights are to the nearest five pounds, we consider the mid - point of the interval where the median lies. The mid - point of the 120 - 125 interval is 122.5.
Answer:
122.5