the weights (to the nearest five pounds) of 38 randomly selected male college students are organized in the…
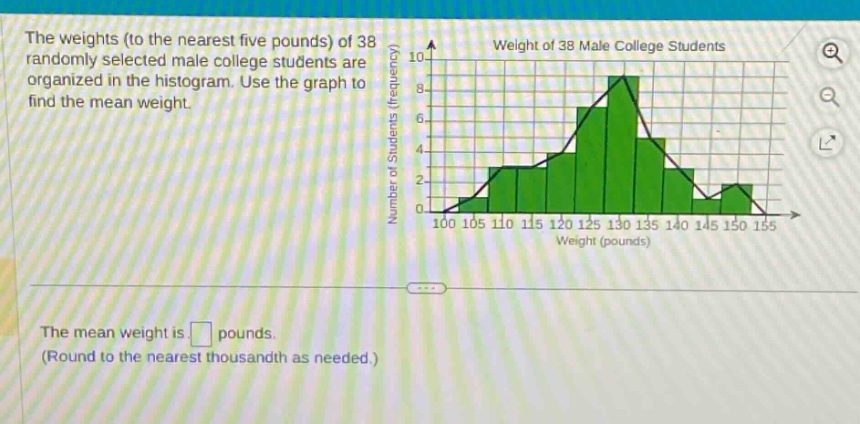
the weights (to the nearest five pounds) of 38 randomly selected male college students are organized in the histogram. use the graph to find the mean weight. the mean weight is pounds. (round to the nearest thousandth as needed.)
Answer
Explanation:
Step1: Determine mid - points of each class
For the class 100 - 105, mid - point $x_1=\frac{100 + 105}{2}=102.5$. For 105 - 110, $x_2=\frac{105+110}{2}=107.5$, for 110 - 115, $x_3=\frac{110 + 115}{2}=112.5$, for 115 - 120, $x_4=\frac{115+120}{2}=117.5$, for 120 - 125, $x_5=\frac{120 + 125}{2}=122.5$, for 125 - 130, $x_6=\frac{125+130}{2}=127.5$, for 130 - 135, $x_7=\frac{130 + 135}{2}=132.5$, for 135 - 140, $x_8=\frac{135+140}{2}=137.5$, for 140 - 145, $x_9=\frac{140 + 145}{2}=142.5$, for 145 - 150, $x_{10}=\frac{145+150}{2}=147.5$, for 150 - 155, $x_{11}=\frac{150 + 155}{2}=152.5$.
Step2: Determine frequencies of each class
From the histogram, frequencies $f_1 = 1,f_2=3,f_3 = 4,f_4=6,f_5 = 8,f_6=9,f_7=4,f_8=2,f_9=1,f_{10}=0,f_{11}=1$.
Step3: Calculate the product $f_ix_i$ for each class
$f_1x_1=1\times102.5 = 102.5$, $f_2x_2=3\times107.5 = 322.5$, $f_3x_3=4\times112.5 = 450$, $f_4x_4=6\times117.5 = 705$, $f_5x_5=8\times122.5 = 980$, $f_6x_6=9\times127.5 = 1147.5$, $f_7x_7=4\times132.5 = 530$, $f_8x_8=2\times137.5 = 275$, $f_9x_9=1\times142.5 = 142.5$, $f_{10}x_{10}=0\times147.5 = 0$, $f_{11}x_{11}=1\times152.5 = 152.5$.
Step4: Calculate the sum of $f_ix_i$ and the sum of frequencies
$\sum_{i = 1}^{11}f_ix_i=102.5+322.5 + 450+705+980+1147.5+530+275+142.5+0+152.5=4800$. $\sum_{i=1}^{11}f_i=1 + 3+4+6+8+9+4+2+1+0+1=38$.
Step5: Calculate the mean
The mean $\bar{x}=\frac{\sum_{i = 1}^{n}f_ix_i}{\sum_{i=1}^{n}f_i}=\frac{4800}{38}\approx126.316$.
Answer:
126.316