weights of packages being shipped (lb)\n6. describe the variability of the data.
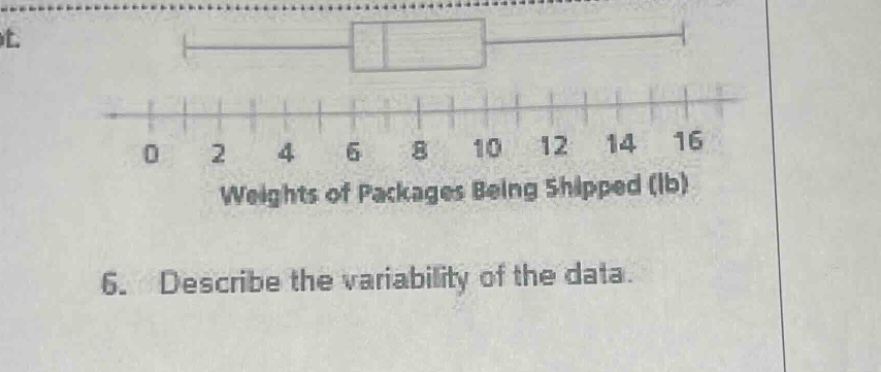
weights of packages being shipped (lb)\n6. describe the variability of the data.
Answer
Explanation:
Step1: Identify key - boxplot features
The box - plot shows minimum, first quartile ($Q_1$), median ($Q_2$), third quartile ($Q_3$), and maximum values. The spread can be described using range and inter - quartile range (IQR).
Step2: Calculate range
The range is the difference between the maximum and minimum values. From the box - plot, the minimum value is close to 0 and the maximum value is 16. So, range=$16 - 0=16$ lb.
Step3: Calculate IQR
The first quartile ($Q_1$) is around 6 lb and the third quartile ($Q_3$) is around 12 lb. The inter - quartile range IQR = $Q_3−Q_1=12 - 6 = 6$ lb.
Step4: Describe variability
The data has a wide overall spread (range = 16 lb), indicating a large difference between the lightest and heaviest packages. The middle 50% of the data (IQR) has a spread of 6 lb, suggesting that the middle portion of the package weights is somewhat more clustered compared to the overall range.
Answer:
The data has a range of 16 lb and an inter - quartile range of 6 lb. The overall spread is relatively large, while the middle 50% of the data is more clustered compared to the entire data set.