each year, the mean score in mathematics on a particular nationwide test is about 500. the daily newspaper…
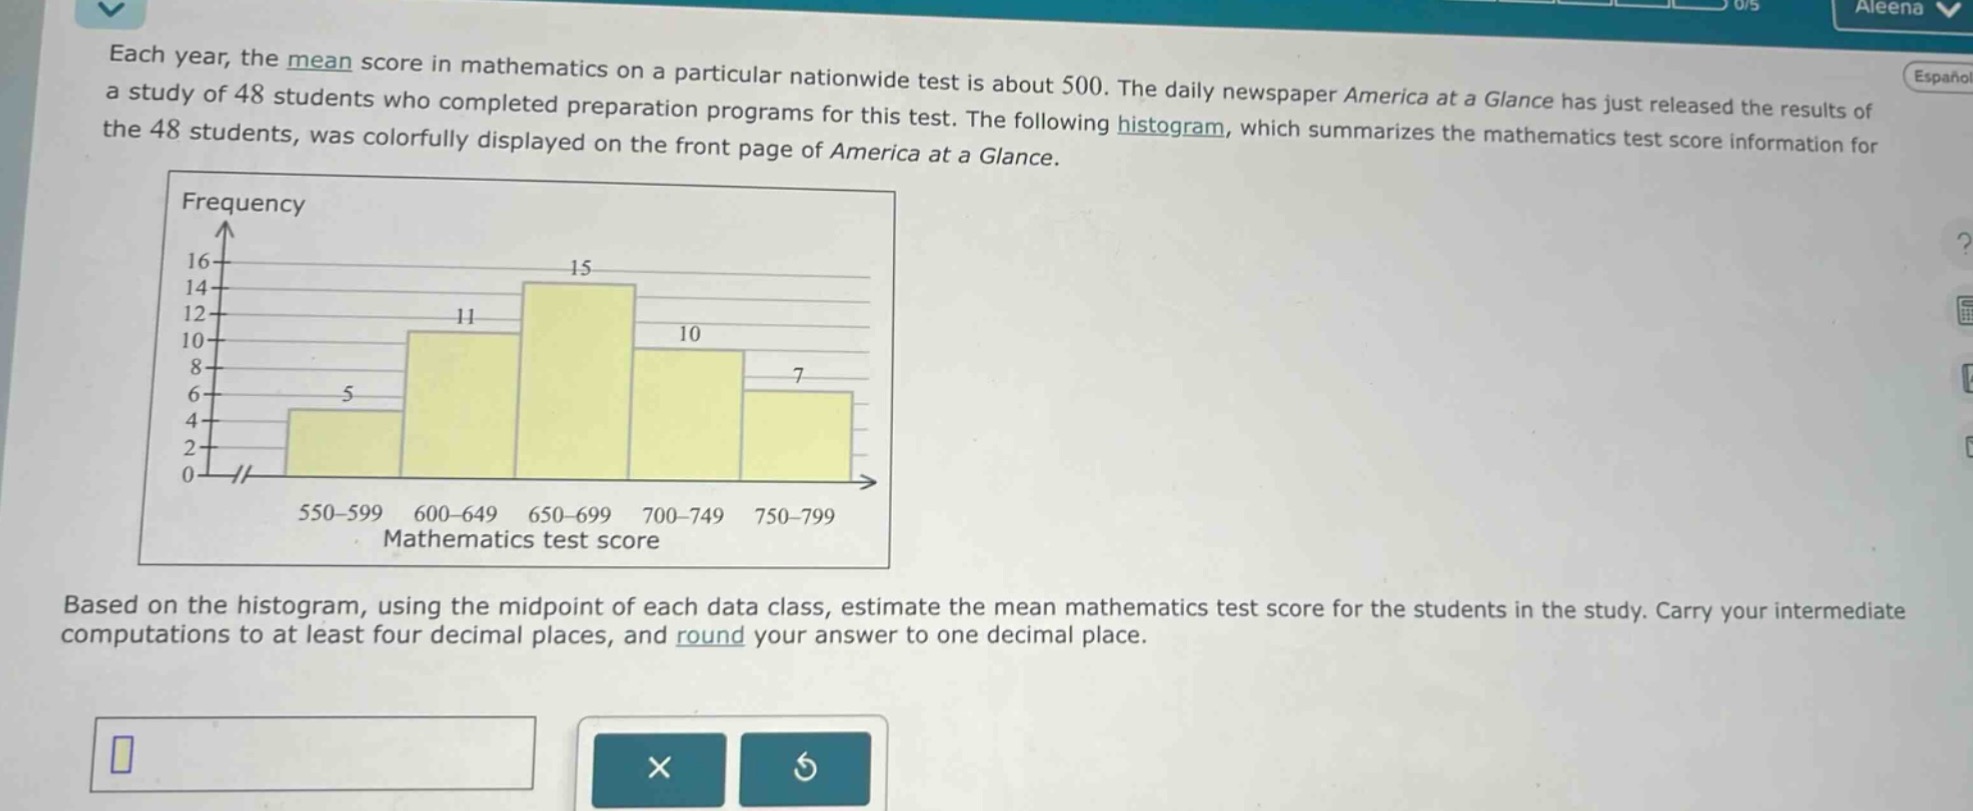
each year, the mean score in mathematics on a particular nationwide test is about 500. the daily newspaper america at a glance has just released the results of a study of 48 students who completed preparation programs for this test. the following histogram, which summarizes the mathematics test score information for the 48 students, was colorfully displayed on the front page of america at a glance. based on the histogram, using the midpoint of each data class, estimate the mean mathematics test score for the students in the study. carry your intermediate computations to at least four decimal places, and round your answer to one decimal place.
Answer
Explanation:
Step1: Find mid - points of each class
For the class 550 - 599, the mid - point $x_1=\frac{550 + 599}{2}=574.5$. For the class 600 - 649, the mid - point $x_2=\frac{600+649}{2}=624.5$. For the class 650 - 699, the mid - point $x_3=\frac{650 + 699}{2}=674.5$. For the class 700 - 749, the mid - point $x_4=\frac{700+749}{2}=724.5$. For the class 750 - 799, the mid - point $x_5=\frac{750 + 799}{2}=774.5$.
Step2: Find the product of mid - point and frequency for each class
The frequencies are $f_1 = 5$, $f_2=11$, $f_3 = 15$, $f_4=10$, $f_5 = 7$. The products are: $x_1f_1=574.5\times5 = 2872.5$ $x_2f_2=624.5\times11=6869.5$ $x_3f_3=674.5\times15 = 10117.5$ $x_4f_4=724.5\times10=7245$ $x_5f_5=774.5\times7 = 5421.5$
Step3: Calculate the sum of the products
$\sum_{i = 1}^{5}x_if_i=2872.5+6869.5 + 10117.5+7245+5421.5=32526$
Step4: Calculate the total frequency
$\sum_{i=1}^{5}f_i=5 + 11+15+10+7=48$
Step5: Calculate the mean
The mean $\bar{x}=\frac{\sum_{i = 1}^{5}x_if_i}{\sum_{i=1}^{5}f_i}=\frac{32526}{48}\approx677.625\approx677.6$
Answer:
$677.6$