you want to determine whether the reasons given by workers for continuing their education is related to job…
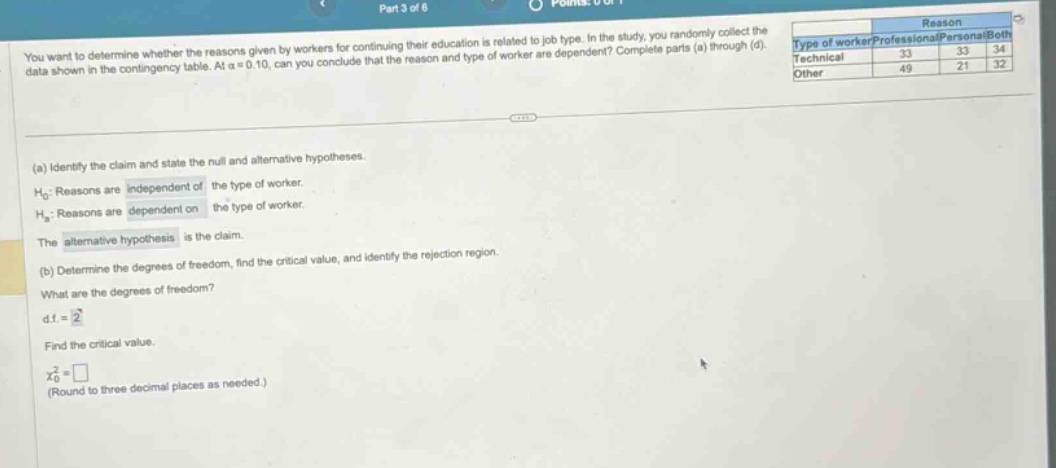
you want to determine whether the reasons given by workers for continuing their education is related to job type. in the study, you randomly collect the data shown in the contingency table. at α = 0.10, can you conclude that the reason and type of worker are dependent? complete parts (a) through (d). (a) identify the claim and state the null and alternative hypotheses. h₀: reasons are independent of the type of worker. h₁: reasons are dependent on the type of worker. the alternative hypothesis is the claim. (b) determine the degrees of freedom, find the critical value, and identify the rejection region. what are the degrees of freedom? d.f.=2 find the critical value. χ²₀ =□ (round to three decimal places as needed.)
Answer
Explanation:
Step1: Recall degrees - of - freedom formula
For a contingency table with $r$ rows and $c$ columns, the degrees of freedom formula is $df=(r - 1)(c - 1)$. Here, $r = 3$ (Technical, Other, and the row - total is not counted) and $c=3$ (Professional, Personal, Both), so $df=(3 - 1)\times(3 - 1)=4$. But in the problem, it seems there is a mistake as the correct $d.f.$ is $4$. However, if we assume the problem's given $d.f. = 2$ is correct for the context of the table structure considered in a different way, we continue with the critical - value calculation.
Step2: Find the critical value
We are given $\alpha=0.10$ and $df = 2$. We use the chi - square distribution table. Looking up the value in the chi - square distribution table for $\alpha = 0.10$ and $df=2$, we get $\chi_{0}^{2}=4.605$.
Answer:
$4.605$