zayne sells tickets at his local movie theater. this graph shows how many tickets he sold for each type of…
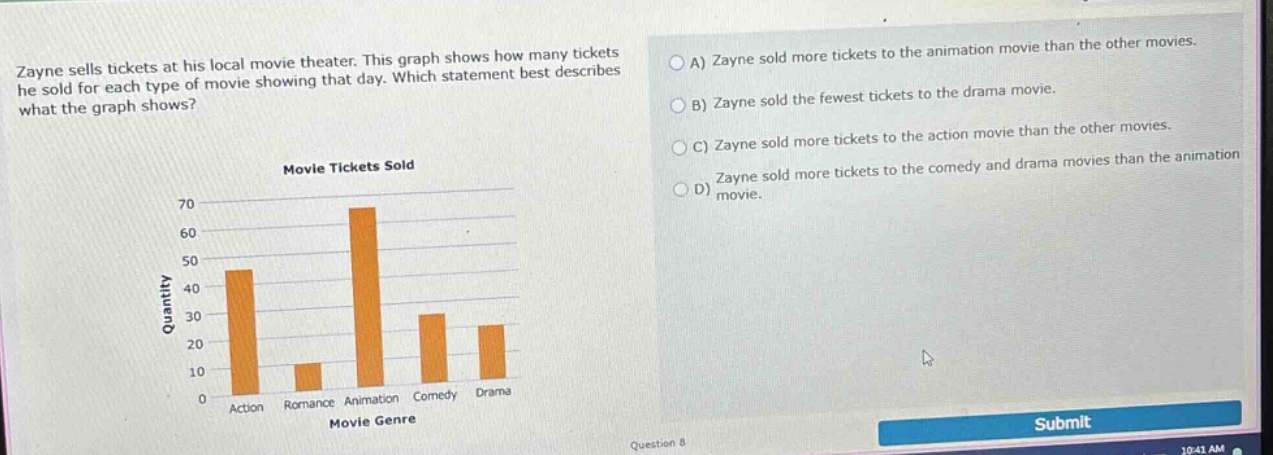
zayne sells tickets at his local movie theater. this graph shows how many tickets he sold for each type of movie showing that day. which statement best describes what the graph shows? movie tickets sold quantity 70 60 50 40 30 20 10 0 action romance animation comedy drama movie genre a) zayne sold more tickets to the animation movie than the other movies. b) zayne sold the fewest tickets to the drama movie. c) zayne sold more tickets to the action movie than the other movies. d) zayne sold more tickets to the comedy and drama movies than the animation movie.
Answer
Explanation:
Step1: Analyze ticket - sales for each genre
From the bar - graph: Action has about 50 tickets sold, Romance has about 10 tickets sold, Animation has about 70 tickets sold, Comedy has about 30 tickets sold, and Drama has about 20 tickets sold.
Step2: Evaluate option A
Animation has the highest number of tickets sold (70) among all genres. So, Zayne sold more tickets to the animation movie than the other movies.
Step3: Evaluate option B
Romance has the fewest tickets sold, not Drama. So, option B is incorrect.
Step4: Evaluate option C
Animation has more tickets sold than Action. So, option C is incorrect.
Step5: Evaluate option D
The sum of Comedy (30) and Drama (20) tickets is 30 + 20=50, which is less than the number of Animation tickets (70). So, option D is incorrect.
Answer:
A. Zayne sold more tickets to the animation movie than the other movies.