a zoo has some new exhibits. in a survey, 1600 zoo attendees are asked to choose their favorite. the results…
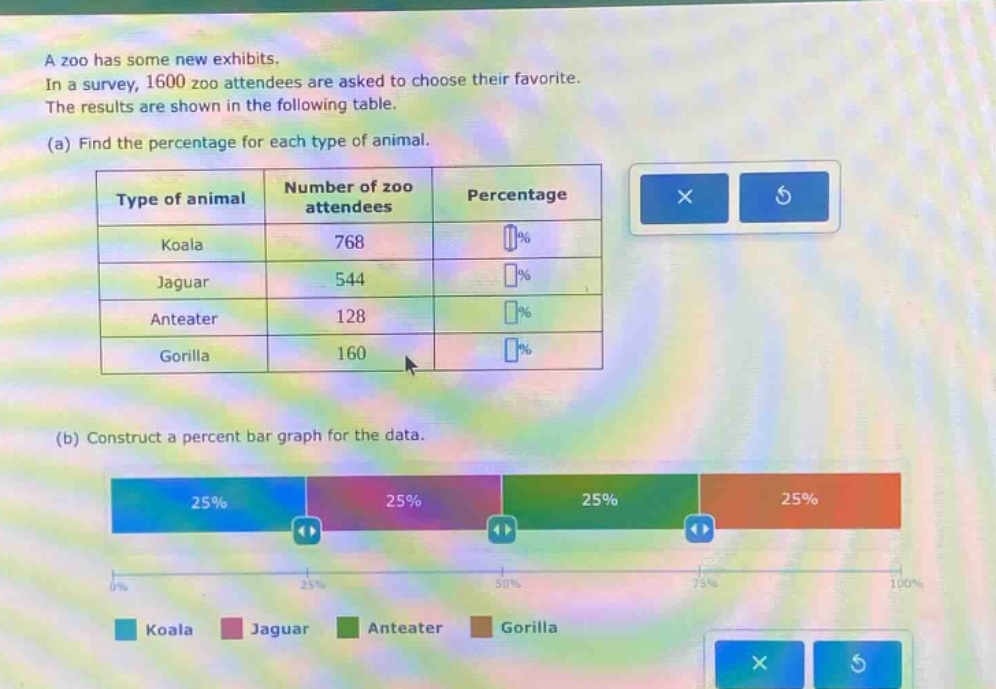
a zoo has some new exhibits. in a survey, 1600 zoo attendees are asked to choose their favorite. the results are shown in the following table. (a) find the percentage for each type of animal.\n|type of animal|number of zoo attendees|percentage|\n|--|--|--|\n|koala|768|%|\n|jaguar|544|%|\n|anteater|128|%|\n|gorilla|160|%|\n(b) construct a percent bar graph for the data.
Answer
Explanation:
Step1: Calculate percentage for Koala
The formula for percentage is $\frac{\text{Number of attendees for Koala}}{\text{Total number of attendees}}\times100%$. The total number of attendees is 1600 and for Koala is 768. So the percentage is $\frac{768}{1600}\times 100% = 48%$.
Step2: Calculate percentage for Jaguar
Using the same formula, with 544 attendees for Jaguar, the percentage is $\frac{544}{1600}\times 100%= 34%$.
Step3: Calculate percentage for Anteater
For Anteater with 128 attendees, the percentage is $\frac{128}{1600}\times 100% = 8%$.
Step4: Calculate percentage for Gorilla
For Gorilla with 160 attendees, the percentage is $\frac{160}{1600}\times 100%= 10%$.
Answer:
| Type of animal | Percentage |
|---|---|
| Koala | 48% |
| Jaguar | 34% |
| Anteater | 8% |
| Gorilla | 10% |
(Note: For part (b) of constructing a percent - bar graph, it is more of a graphical task. But the percentages calculated above are the key data for constructing it. The bars for Koala, Jaguar, Anteater and Gorilla should be drawn to represent 48%, 34%, 8% and 10% respectively on the graph.)